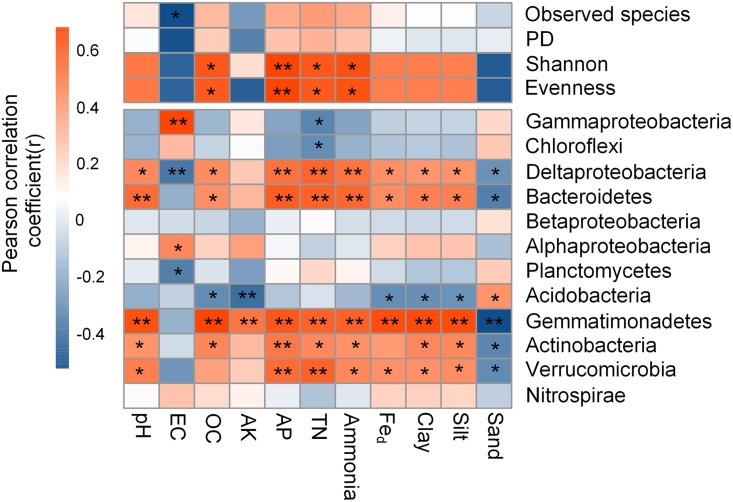
FIG 2.
Correlation between the α-diversity indexes, dominant phyla/classes, and physicochemical properties. Correlation coefficients ranged from negative to positive and are indicated by color intensity, changing from dark blue to red, respectively, as illustrated in the key. **, P < 0.01; *, P < 0.05. For abbreviations, see Table 1.

