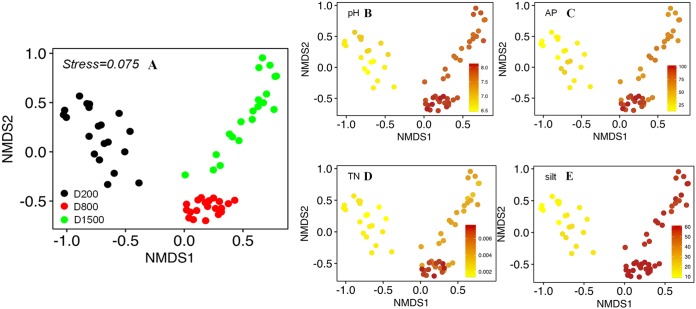
FIG 3.
(A) Nonmetric multidimensional scaling (NMDS) plots were used to visualize the differences in bacterial community compositions based on the Bray-Curtis distance among the sediment transects. (B to E) NMDS plots displaying four environmental variables, pH (B), AP (C), TN (D), and silt content (E), that mainly explain variations in bacterial community composition. The parameter values are color-coded in the corresponding heat map legends.

