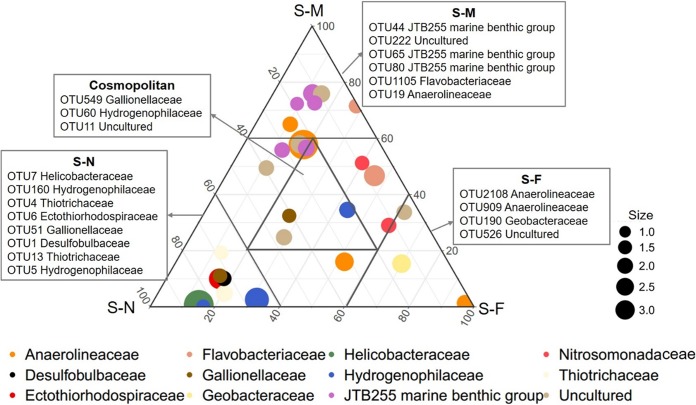
FIG 4.
Ternary plot showing the distribution of the 30 most abundant OTUs in the sediment transects. The symbol size indicates the relative abundance of each OTU. The ranking in each box indicates the relative abundance of the OTU (shown at the family level) from high to low. Each dot is colored at the family level. See Table 1 for transect notation.

