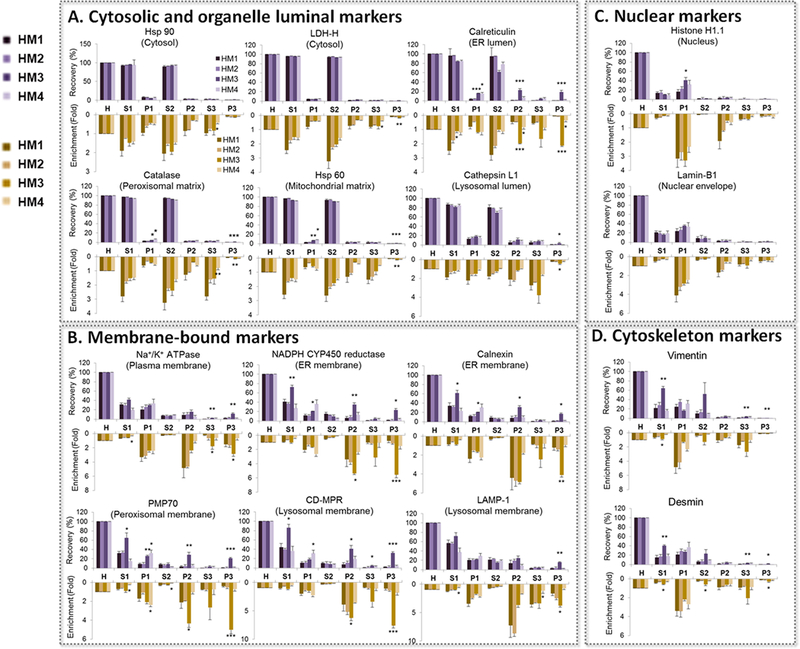
Figure 3. Effect of four homogenization methods on the recovery (purple upward bars) and enrichment (orange downward bars) of organelle markers in different liver subcellular fractions.

A. Cytosolic and organelle luminal markers; B. Membrane-bound markers; C. Nuclear markers, and D. Cytoskeleton markers. Typical low- (9,000 xg) and ultra- (120,000 xg) centrifugation speeds were used. The data are shown as mean±S.E., n=3. HM1: Bead homogenizer (2 cycles); HM2: Bead homogenizer (3 cycles); HM3: Hand-held rotary homogenizer with plastic probes; HM4: Cryogenic grinding with mortar and pestle. H: Homogenate; S1: S9 fraction; P1: Pellet 1 (heavy membrane); S2: Cytosolic fraction; P2: Pellet 2; S3: Wash supernatant; P3: Microsomal fraction. Statistical analysis was performed using one-way ANOVA and Dunnett post-test (HM1 as control). * P<0.05, **P<0.01 and ***P<0.001
