
Figure 2.
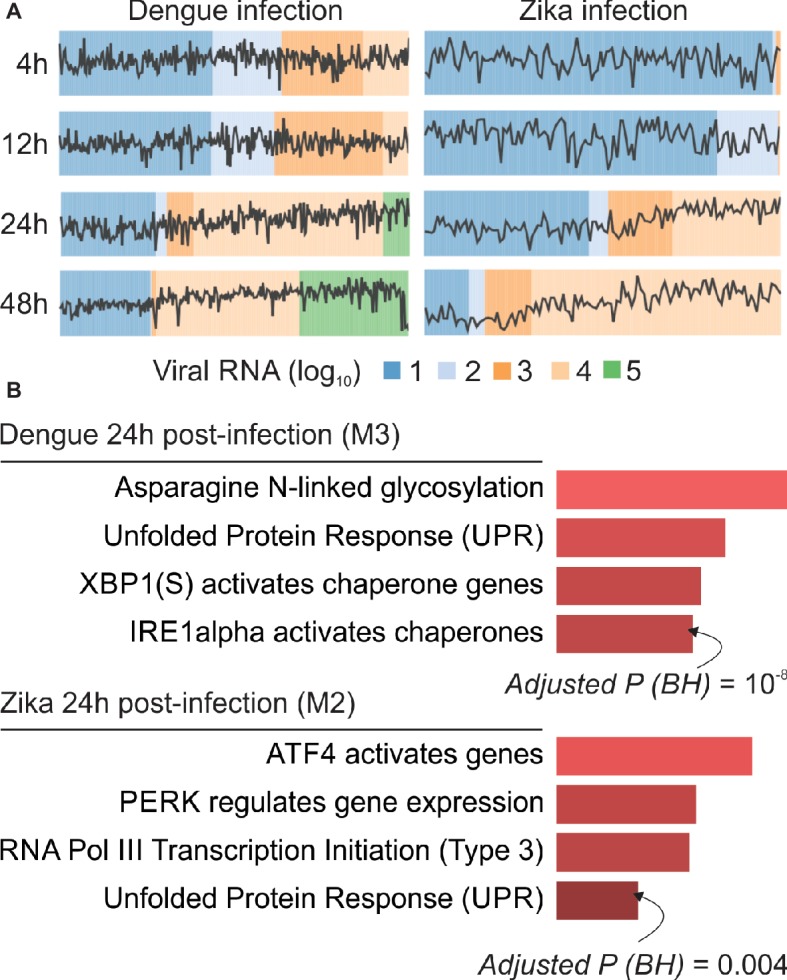
webCEMiTool applied to single-cell RNA-seq data. (A) Profile plot of co-expressed gene modules. We selected one representative module for each time point post-dengue virus infection (left) or post-Zika virus infection (right). The black line represents the median expression activity of genes from the modules across each sample. The colors represent the different amount of virus RNA within the cell. (B) Overrepresentation analysis of selected modules at 24 h post-virus infection. The bar graphs were adapted from the Enrichr webtool linked to webCEMiTool. The bars are proportional to the −log10 adjusted p-value (Benjamini-Hochberg) of the enriched pathways in a module.