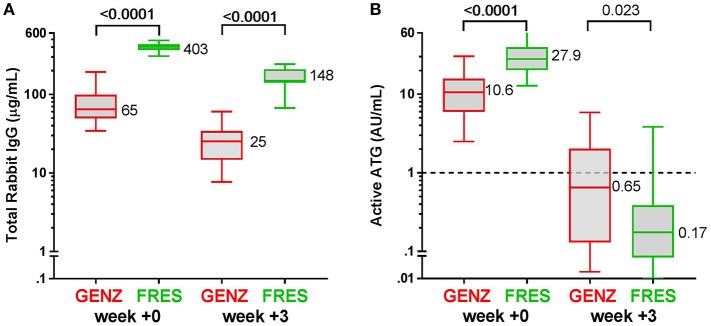
Figure 2.
Box plots of serum/plasma concentration of total Rabbit IgG (total ATG) and active ATG in ATG-GENZ (Genzyme, red) and ATG-FRES (Fresenius, green) treated patients. (A) Total Rabbit IgG concentration in ATG-FRES treated patients at week 0 (day of graft infusion) and week +3 (expected time of neutrophil engraftment) is significantly higher in comparison with ATG-GENZ treated patients. (B) Active ATG concentration at week 0 in ATG-FRES treated patients is significantly higher in comparison with ATG-GENZ treated patients, but at week +3 the serum/plasma level of active ATG in ATG-FRES treated patients is lower than in ATG-GENZ treated patients (0.17 vs. 0.65 AU/mL).

