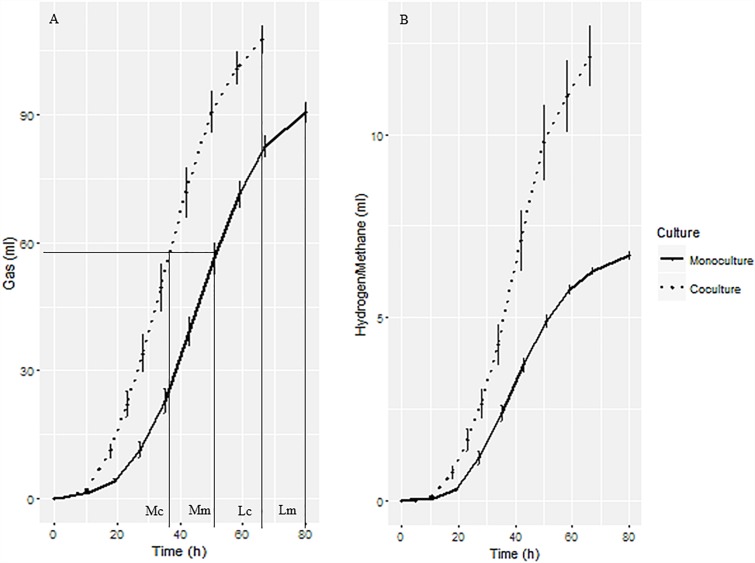
FIGURE 1.
Gas production of anaerobic fungal monoculture and fungal-methanogen co-culture. (A) Cumulative gas production curve showing the sampling time for transcriptomic, proteomic, and fermentation end products analysis. Mc, mid-growth stage of co-culture; Mm, mid-growth stage of monoculture; Lc, late-growth stage of co-culture; Lm, late-growth stage of monoculture. (B) H2 and CH4 production from fungal monoculture and co-culture, respectively.

