FIGURE 3.

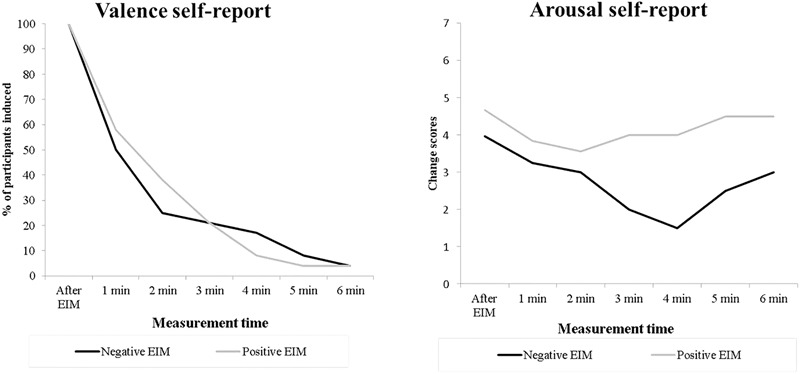
Percentage of participants that remained induced (left) and arousal self-reported rates induced for induced participants (right) across measurement times.

Percentage of participants that remained induced (left) and arousal self-reported rates induced for induced participants (right) across measurement times.