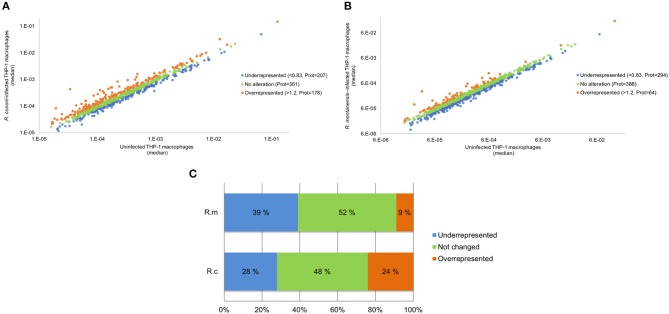
Figure 1.
Overall analysis of R. conorii- and R. montanensis-induced changes in global proteome of THP-1 macrophages. (A,B) Scatterplot representation of changes in protein abundance of THP-1 macrophages upon infection with R. conorii (A) and R. montanensis (B). The 746 quantified proteins that were confidently quantified in all 3 experimental conditions were plotted and considered altered when a change of at least 20% in abundance (fold change ≤ 0.83 or fold change ≥ 1.2) was observed between infected and uninfected conditions. Proteins that were considered to decrease, not change or increase its abundance upon infection are represented in blue, green and orange, respectively. (C) Bar chart displaying the percentage (out of the 746 quantified proteins that were confidently quantified) of host proteins that were considered to decrease, not change or increase its abundance upon infection with both R. conorii and R. montanensis. See also Supplementary Table 2.

