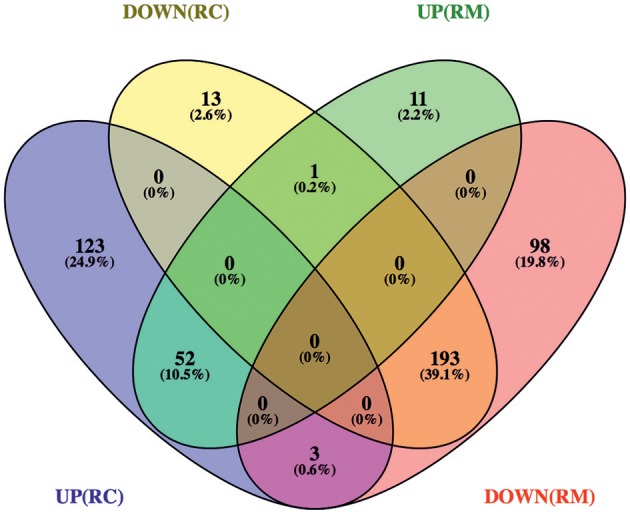
Figure 2.

Venn diagram depicting the number and distribution of host proteins that changed their abundance upon infection with R. conorii or R. montanensis. Host proteins that change their abundance in the same direction (increase or decrease abundance) upon infection with both R. conorii and R. montanensis are considered to be a common response to infection. On the other hand, host proteins that change their abundance in only one infection condition, but show unchanged protein levels in the other, are considered to be a species-specific host response. DOWN(RC), yellow—proteins that are in decreased abundance in R. conorii-infected THP-1 macrophages compared to uninfected THP-1 macrophages; UP(RC), blue—proteins that are in increased abundance in R. conorii-infected THP-1 macrophages compared to uninfected THP-1 macrophages; DOWN(RM), red—proteins that are in decreased abundance in R. montanensis-infected THP-1 macrophages compared to uninfected THP-1 macrophages; UP(RM), green—proteins that are in increased abundance in R. montanensis-infected THP-1 macrophages compared to uninfected THP-1 macrophages. Individual information about the proteins in each group of the Venn diagram can be found in Supplementary Table 3. Venn diagrams were obtained using VENNY 2.1 (http://bioinfogp.cnb.csic.es/tools/venny/).
