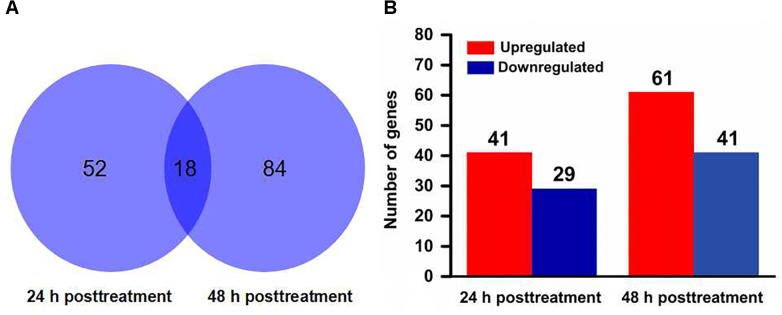
FIGURE 2.
Distribution of differentially expressed genes in Tetranychus cinnabarinus in response to scopoletin. (A) Venn diagram showing the total number of differentially expressed genes at 24 and 48 h posttreatment, and the number of overlapped genes between two time points. (B) The number of up-regulated and down-regulated genes at 24 and 48 h after scopoletin treatment.

