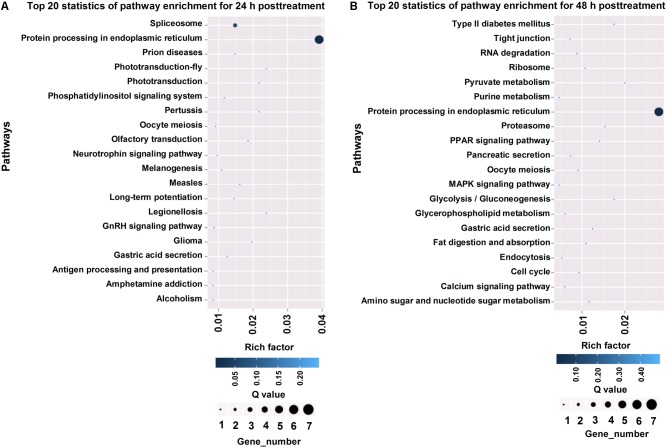
FIGURE 4.
KEGG pathway analysis of differentially expressed genes in T. cinnabarinus in response to scpoletin. (A) Top 20 enriched KEGG pathways of differentially expressed genes at 24 h posttreatment. (B) Top 20 enriched KEGG pathways of differentially expressed genes at 48 h posttreatment. Rich factor is defined by the ratio of the number of differentially expressed genes enriched in the pathway and the number of all genes enriched in the same pathway.

