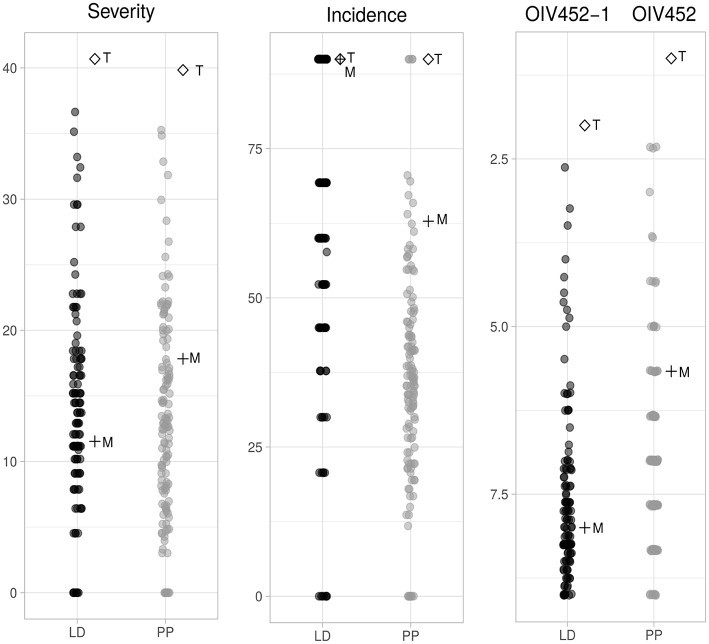
Figure 1.
Phenotypic distribution of the three different parameters associated with resistance to P. viticola in the M×T progeny. Severity and incidence are expressed in percentage while the OIV descriptor follows a discrete scale from 1 to 9. These parameters were scored at 6 days post-inoculation (dpi) for leaf disks (LD) and at 8 dpi for potted plants (PP). The data were collected in June and August 2012 for the segregating population and in June and August 2013 for the two parental lines. The reproducibility of the two experiments was tested (p ≤ 0.05) on data collected in August 2012 and 2013 for the same genotypes as shown in Figure S1. M, “Merzling”; T, “Teroldego”.

