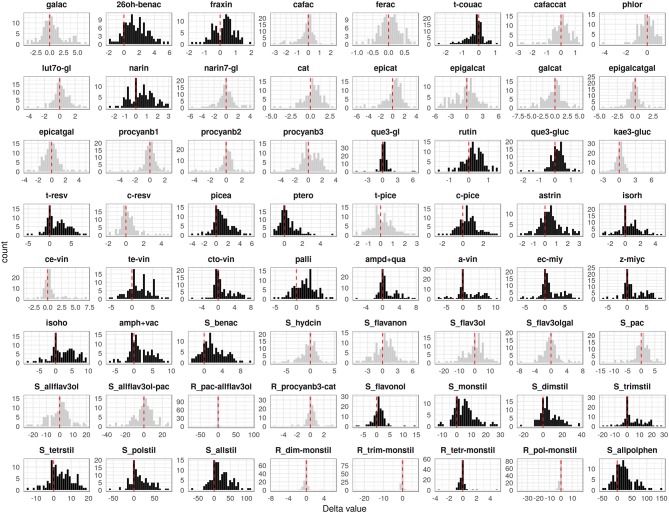
Figure 2.
Distribution of the difference between P. viticola-inoculated (PI) and mock-inoculated (MI) values (delta) associated with 64 polyphenol-related parameters recorded in the M×T progeny. Black distributions highlight significantly modulated compounds. The meaning of the parameter abbreviations is reported in Table S1B.

