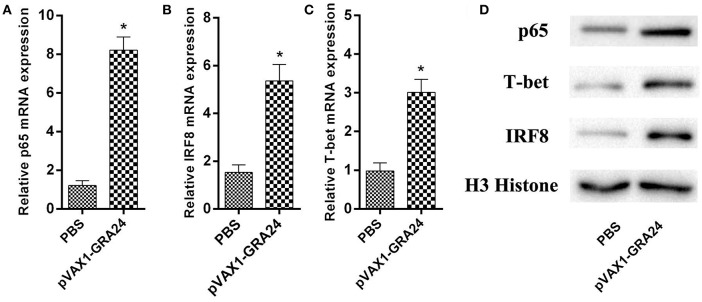
Figure 5.
The mRNA and protein expression levels of p65, IRF8, and T-bet. (A–C) The mRNA levels of p65, IRF8, and T-bet; (D) The protein levels of p65, IRF8 and T-bet. Data are expressed as the mean ± SD (n = 5) from three independent experiments. Asterisks (*) indicate statistically significant differences (p < 0.05) compared with the control groups. PBS, phosphate-buffered saline.

