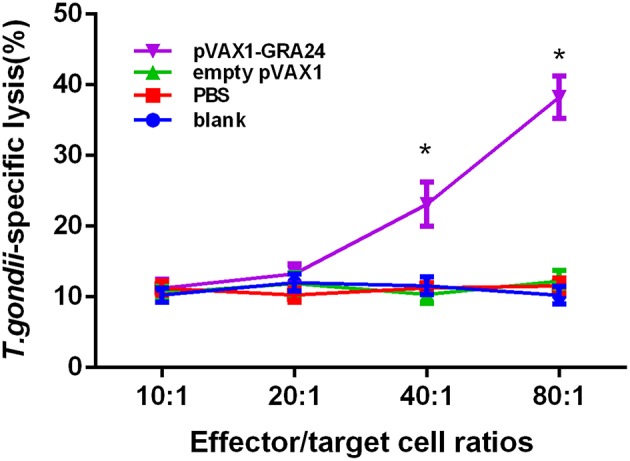
Figure 6.

CTL activities of spleen lymphocytes in pVAX1-GRA24 immunized mice. The vertical axis shows T. gondii-specific lysis as a percentage of the total possible lysis (%). CTL, cytotoxic T lymphocyte; PBS, phosphate-buffered saline. Asterisks (*) indicate statistically significant differences (p < 0.05) compared with the control groups.
