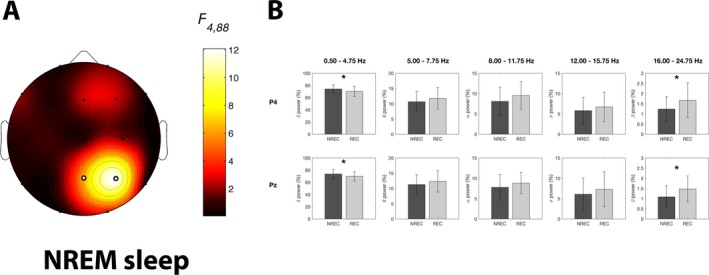
Figure 5.

Results of the statistical comparisons on EEG power of NREM sleep. (A) Statistical maps reporting the F‐values associated to the interaction effects from the two‐way repeated‐measures ANOVAs Recall (NREC vs. REC) × Frequency Band (Delta vs. Theta vs. Alpha vs. Sigma vs. Beta) on EEG power of NREM sleep for each scalp location. Significant interaction effects after the FDR‐correction for multiple comparisons are indicated by white dots (F ≥ 6.33; P ≤ 0.0002). (B) Mean EEG power for the five frequency bands during NREM sleep in the no‐recall (NREC, dark gray) and the recall (REC, light gray) conditions, expressed as percentage of the total EEG power. Data are reported for the electrodes showing a significant interaction effect in the ANOVAs Recall × Frequency Band. Error bars represent the standard errors. Asterisks indicate statistically significant differences between the REC and NREC conditions by planned comparisons (paired t‐tests with P ≤ 0.05).
