
Figure 6.
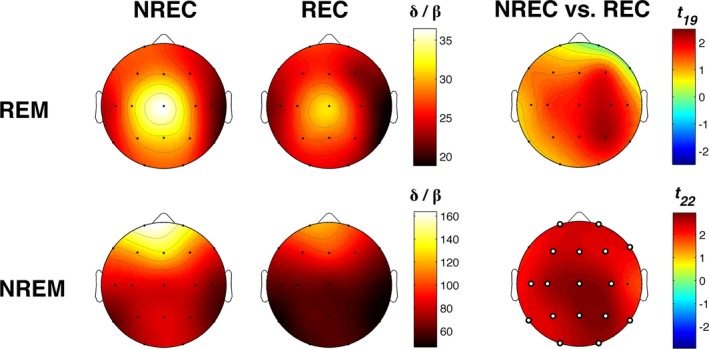
Activation index. Topographic distribution of the activation index, defined as the delta/beta ratio, for REM (1st row) and NREM (2nd row) sleep in the no‐recall (NREC, 1st column) and the recall (REC, 2nd column) conditions. The maps are scaled between the minimal and maximal considering the two experimental conditions, separately for REM and NREM sleep. Statistical maps of the comparisons between no‐recall and recall conditions by paired t‐test are also plotted (3rd column) for REM and NREM sleep. The statistical maps are scaled symmetrically according to the absolute maximal t‐value across the statistical comparisons, separately for REM and NREM sleep. Significant differences after the FDR‐correction for multiple comparisons are found only for NREM sleep and are indicated by white dots (t ≥ 2.28; P ≤ 0.0324).