
Figure 1.
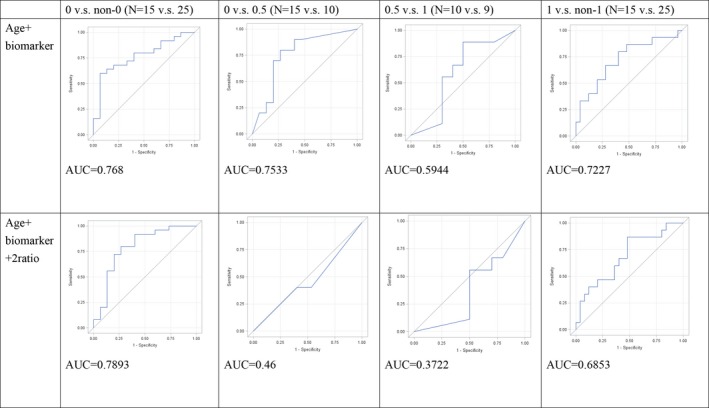
Results of multivariate ROC analysis. ROC analysis plots for pairwise comparison based on CDR values using age and significant metabolite levels. Results for the combination of age and individual metabolites are shown in the top row. The bottom row contains plots obtained after adding Cit/Arg and Kyn/Trp ratio biomarkers. The curves show the best delimitation of AUC for each combination. Designation 0 versus non‐0 refers to CDR and indicates the power of that particular marker combination to discriminate normal controls from other participants. Similarly, 0 versus 0.5 refers to discrimination of normal controls from MCI patients (0.5 vs. 1, discrimination between MCI and AD; 1 vs. non‐1, discrimination between AD and non‐AD participants).