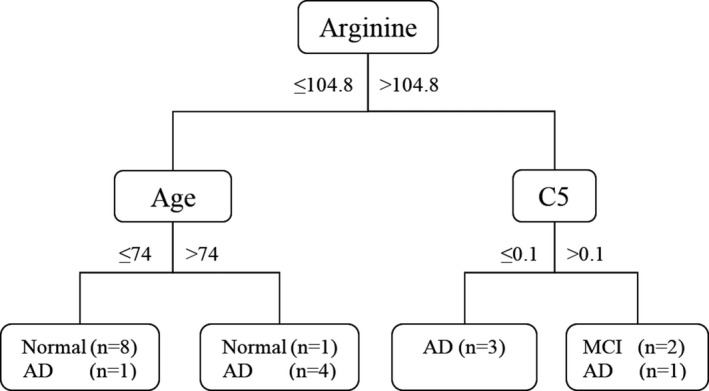
Figure 2.

Decision tree model generated in the training group. C5.0 classification tree for the best candidate predictors of AD and MCI. Boxes at the end of each classification path contain the number of participants satisfying the selected conditions in each of the diagnostic group. The decision values are given as years of age and μmol/L for arginine and C5 blood plasma concentrations. MCI, mild cognitive impairment; AD, Alzheimer's disease
