. 2019 Feb 18;6(3):456–465. doi: 10.1002/acn3.716
© 2019 The Authors. Annals of Clinical and Translational Neurology published by Wiley Periodicals, Inc on behalf of American Neurological Association.
This is an open access article under the terms of the http://creativecommons.org/licenses/by/4.0/ License, which permits use, distribution and reproduction in any medium, provided the original work is properly cited.
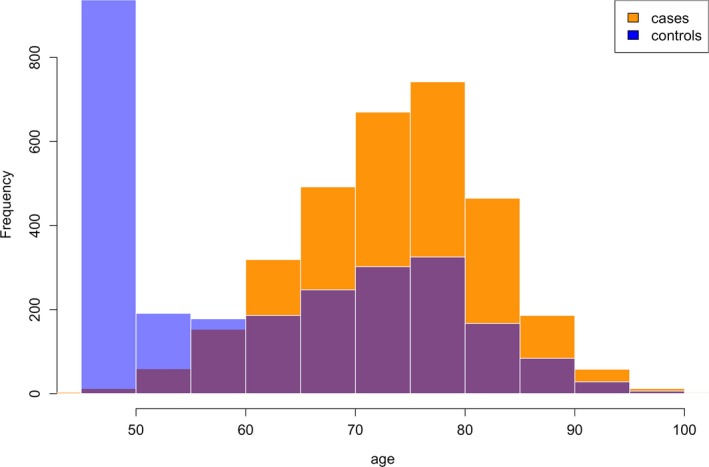
Figure 1.

Histogram of age of AD cases and controls in the GERAD dataset.
