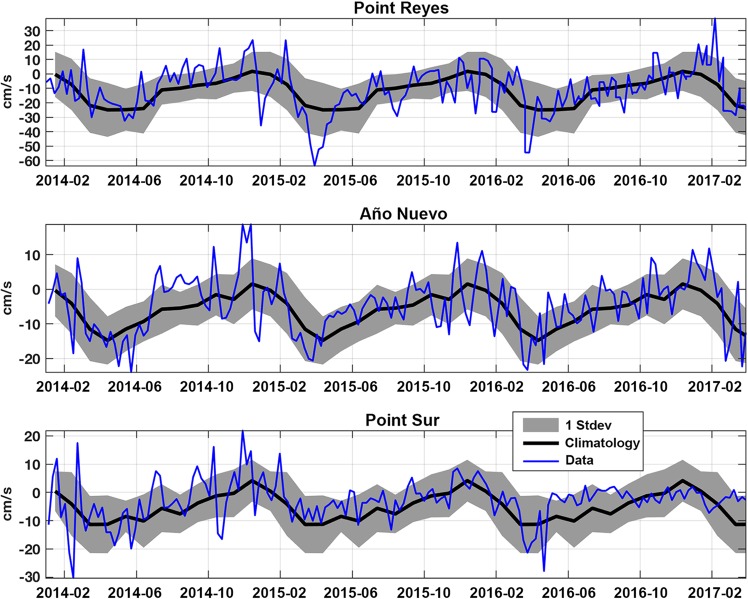
Figure 3.
Temporal variation in alongshore flow velocity (North-South) at three locations: northwest of Point Reyes (upper panel), Año Nuevo (middle panel), Point Sur (lower panel). Values are weekly-averaged velocities (cm/s) derived from high-frequency radar. Positive values indicate northward flow, and negative values indicate southward flow. Data compare 2014–2017 (blue line) to mean climatology (2002–2011) and standard deviation (black line and gray shading, respectively).

