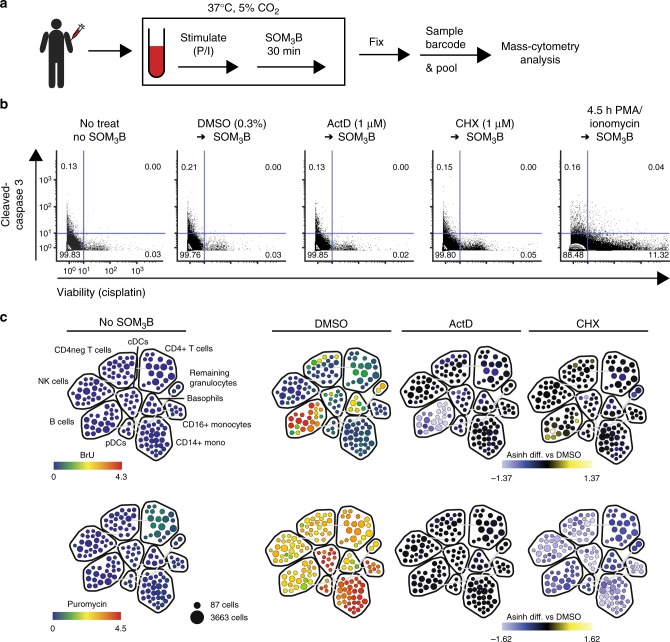
Fig. 3.
SOM3B does not interfere with primary immune sample cell fitness and predictively reflects biosynthesis activity. a Whole blood from a healthy donor stimulated in a time course prior to SOM3B analysis (P/I; PMA/Ionomycin). b Biaxial plots with inlaid frequency of whole blood mononuclear cells undergoing apoptosis (cleaved-Caspase3 positive) and non-viable cells (positive cisplatin staining). Inlaid quadrant numbers indicate the percent of total events within each gate. Approximately 100,000 events displayed for each condition. c Manually annotated SPADE map of in silico gated peripheral immune mononuclear cell subsets in whole blood from a single healthy donor not labeled with SOM3B reagents (far left), or treated with DMSO (middle left), Actinomycin D (middle right), and Cycloheximide (far right) prior to SOM3B labeling. Rainbow color overlay scaled to indicate median expression for each cluster (BRU—top, Puromycin—bottom). Blue-yellow color overlay scaled to indicate the difference between the transformed median value (ArcSinh cofactor of 5) of a given cluster from the complementary control cluster (DMSO). Weak puromycin signal in “No SOM3B” is derived from background isotopic contamination in CD4+ T cells with high CD4 expression (CD4-Gd157 into Puromycin-Gd158). Number of cell events displayed; 130,000–160,000 single cell events for each map, experiments were performed multiple times, representative plots and maps shown

