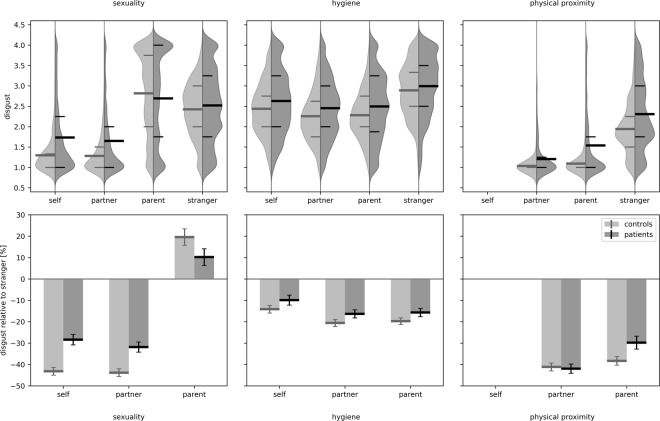
Figure 2.
Disgust is increased and source effect is reduced in patients compared to controls. Upper row: disgust for the three content scales ‘sexuality’, ‘hygiene’, and ‘physical proximity’ (from left to right). For each of the content scales, the probability distribution is depicted for the four disgust source scales ‘self’, ‘partner’, ‘parent’, and ‘stranger’ and for the two different groups ‘controls’ (left, light grey) and ‘patients’ (right, dark grey). Additionally, the means (bold lines) as well as the 25th and the 75th percentile (narrow lines) of the distributions are shown. Lower row: relative disgust (as percentage) for the source categories ‘self’, ‘partner’, and ‘parent’ in relation to ‘stranger’ on the three content scales. Depicted are group means and 95% confidence intervals for the two different groups ‘controls’ (left, light grey) and ‘patients’ (right, dark grey).

