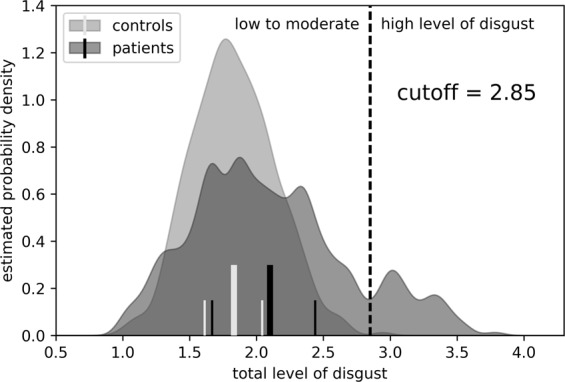
Figure 4.

Disgust in patients shows a bimodal distribution. Probability densities for the overall disgust in the two groups ‘controls’ (light grey) and ‘patients’ (dark grey). Additionally depicted are the positions of the means (bold lines) as well as the 25th and the 75th percentile (narrow lines). Within the patient group, the distribution is bimodal, and we therefore separate the subgroup with ‘high disgust’ sensitivity by introducing a cutoff at 2.85. This cutoff is used for a subgroup analysis (see main text).
