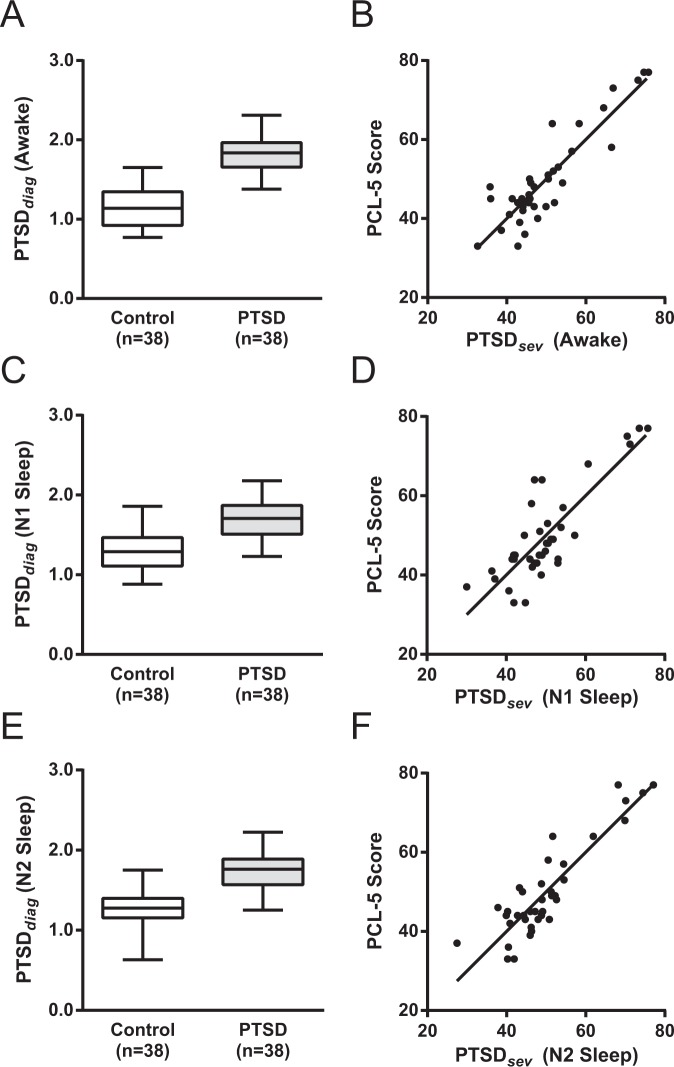
Figure 3.
Comparison of PTSDdx between PTSD and Control groups (Left Column); PCL-5 vs PTSDsev of PTSD group (Right Column). Left column: Boxplots of PTSDdx brain coherence marker for control and PTSD groups in wakefulness (Panel A), N1 Sleep (Panel C), N2 Sleep (Panel E). On each box, the central mark is the median, the edges of the box are the 25th and 75th percentiles, the whiskers extend to the most extreme data-points the algorithm considers to be not outliers, and the outliers are plotted individually. Right Column: Scatter plots of PTSDsev vs PCL-5 in groups in wakefulness (Panel B), N1 Sleep (Panel D), N2 Sleep (Panel F), as well as the regression line for each state.

