Figure 1.
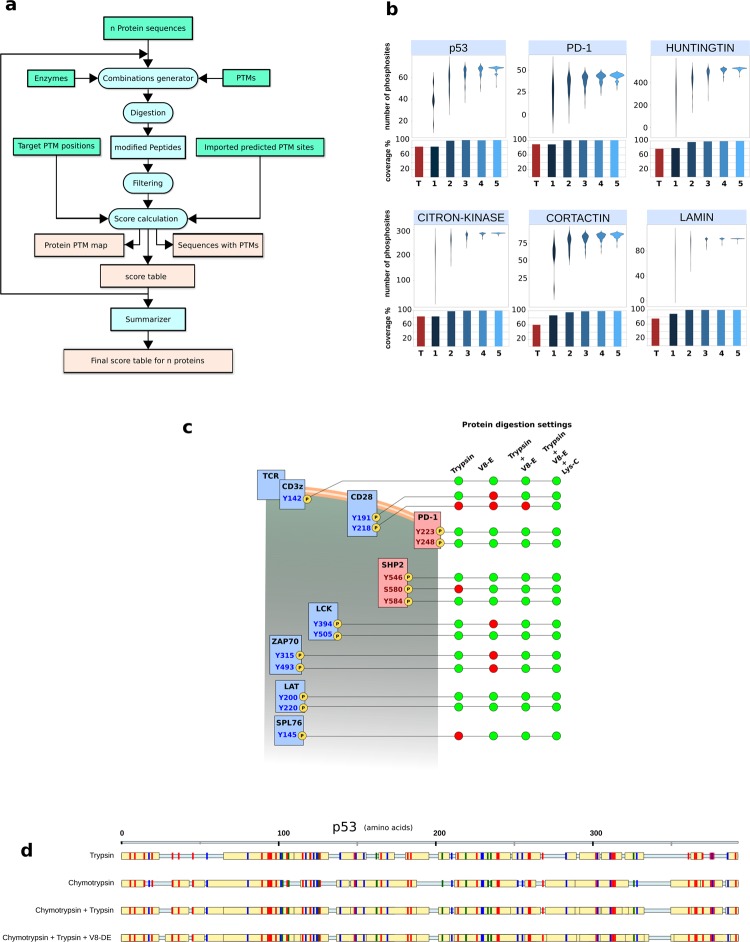
(a) Chart of PTMselect algorithm for PTMs discovery. Input files are in green boxes and output results in beige boxes. (b) PTMselect analysis of six protein sequences: p53, PD-1, Huntingtin, Citron-kinase, Cortactin and Lamin. For each protein, violin plots illustrate the range of phosphosites accessible by mass spectrometry, between worst and best digestion settings. The simulation was done with 8 enzymes and CNBr and [1–5] parallel digestions. Histograms show the percentage of coverage of all possible phosphosite positions with trypsin (red) and the best subsets of [1–5] proteases simulated by PTMselect (blue scale). (c) Example of simultaneous PTM analysis on multiple proteins with the targeted analysis of the TCR signaling pathway17. Stimulatory proteins are in blue and inhibitory proteins are in pink. Phosphosites of the proteins are yellow circles. The phosphosites of the TCR signaling pathway were used as targets in PTMselect and identifiable (green) and unidentifiable (red) phosphosites by a given set of digestion settings are illustrated for some of the best parallel digestions simulated by PTMselect: trypsin, V8-E and Lys-C. (d) Example of Phosphorylation map. The p53 protein was processed in PTMSelect and the maps obtained with trypsin and some of the best [1–3] protease combinations suggested by PTMselect are illustrated, showing a progressive increase of phosphosites coverage. Serine, threonine and tyrosine residues are in red, blue and green, respectively, and identifiable phosphopeptides are in yellow boxes.

