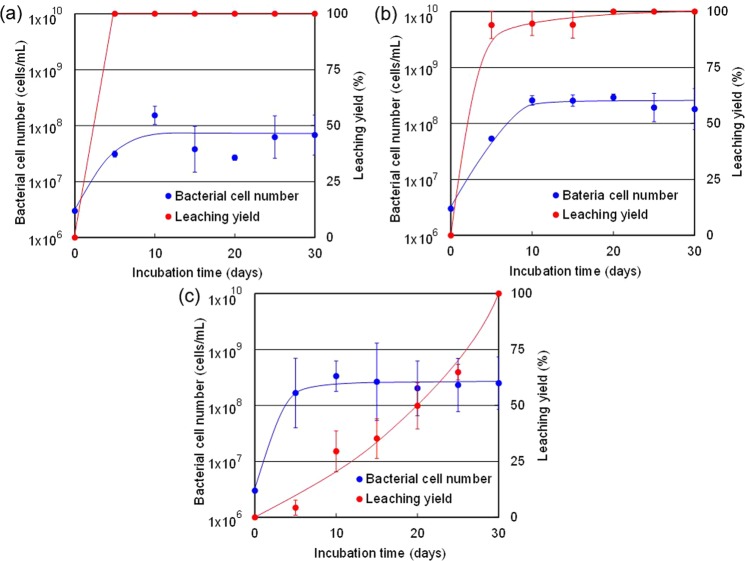
Figure 4.
Dynamic changes of bacterial cell number and leaching yield of gold from the ore sample during the incubation experiments. Temporal changes of bacterial cell number (blue plots) and Au leaching yield in the ore sample (red plots) in the culture solution of bacterial strains (a) a-1, (b) e-2 and (c) f-1. The bacterial cell number is indicated by the left vertical axis in cells/mL with a logarithmic scale. The leaching yield is indicated by the right vertical axis in percentage with a linear scale.

