Figure 3.
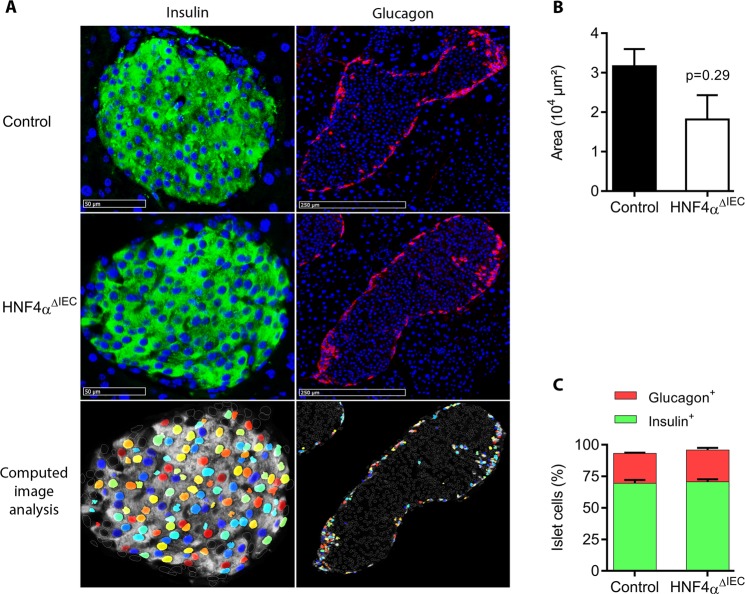
Pancreatic islet structures of HNF4αΔIEC mice. (A) Representative immunofluorescence of insulin and glucagon on two distinct islets of Langerhans sections obtained from adult control and HNF4αΔIEC mice. Computed image analysis using CellProfiler (3.1.5) was designed to quantify labeled cells. Representative image analysis obtained from HNF4αΔIEC mice islet sections (bottom panel) highlights positive detected cells (colored nuclei), overlapping immunofluorescence (white diffuse staining) and non-labeled islet cells (empty and white circled nuclei). (B) Pancreatic islets area measured in adult control (black column) and HNF4αΔIEC (white column) mice (n = 4–5). (C) Relative population of cells positive for insulin (green columns) or glucagon (red columns) signals in pancreatic islets of adult control and HNF4αΔIEC mice (n = 3–5).

