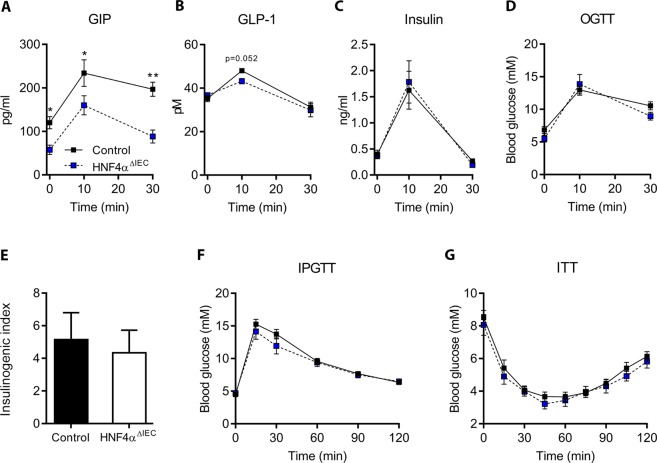
Figure 4.
Hormonal and glycemic response in HNF4αΔIEC mice. Circulating GIP (A), GLP-1 (B) and insulin (C) levels measured by ELISA in control (black squares) and HNF4αΔIEC (blue squares) mice following an oral glucose tolerance test (OGTT) (n = 4–10). (D) Blood glucose measured in control (black squares) and HNF4αΔIEC (blue squares) mice during OGTT (n = 4 = 10). (E) Insulinogenic index was calculated in control (black columns) and HNF4αΔIEC (white columns) mice as follows: Δinsulin peak/Δblood glucose peak, where Δ is the time point concentration minus baseline level (n = 6–7). (F) Blood glucose measured in control (black squares) and HNF4αΔIEC (blue squares) mice during an intraperitoneal glucose tolerance test (IPGTT) (n = 7–9). (G) Insulin tolerance test (ITT) performed on control (black squares) and HNF4αΔIEC (blue squares) mice (n = 6–11).

