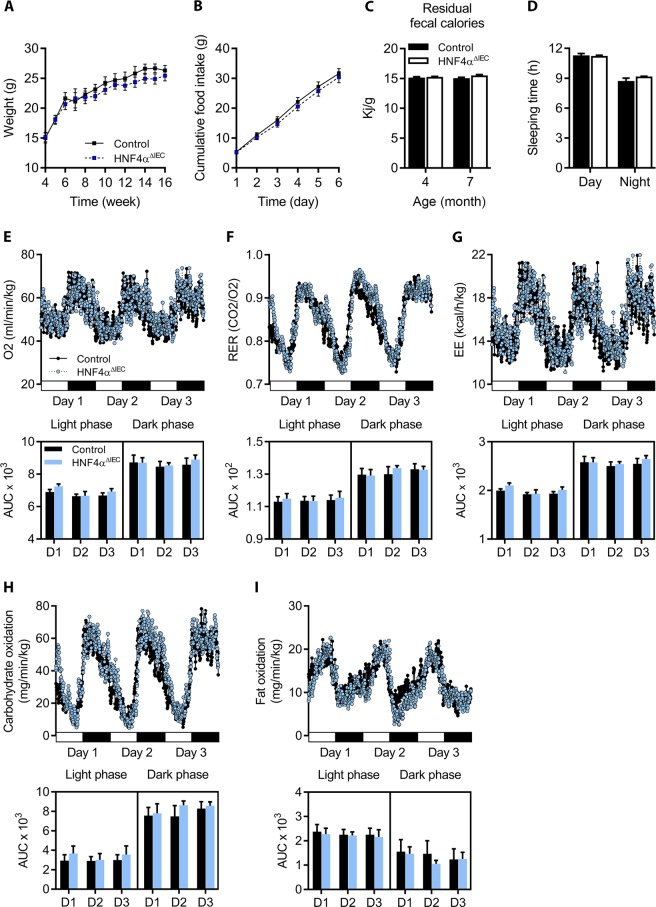
Figure 5.
Nutrition behaviors and energy metabolism in HNF4αΔIEC mice. (A) Weight curves for adult control (black squares) and HNF4αΔIEC (blue squares) mice (n = 4–13). (B) Cumulative food intake was monitored in metabolic cages during 6 consecutive days for both adult control (black squares) and HNF4αΔIEC (blue squares) mice (n = 5–6). (C) Calorie density determined from fecal samples collected from 4-month-old and 7-month-old control (black columns) and HNF4αΔIEC (white columns) mice (n = 3–5). (D) Sleeping time monitored in metabolic cages and calculated as the mean of 3 consecutive days for both adult control (black columns) and HNF4αΔIEC (white columns) mice (n = 7). Oxygen consumption (E), respiratory exchange ratio (RER) (F), and energy expenditure (EE) (G) measurements acquired for 3 consecutive days for both adult control (black circles) and HNF4αΔIEC (blue circles) mice (n = 7) with corresponding area under the curve (AUC). Estimated oxidative rates for carbohydrates (H) and fat (I) with AUC calculated for 3 consecutive days for both adult control (black circles) and HNF4αΔIEC (blue circles) mice (n = 7).

