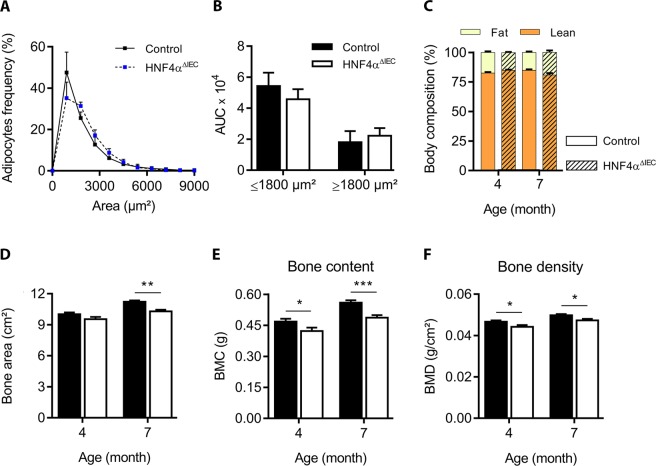
Figure 6.
White adipocyte tissue density and body composition in HNF4αΔIEC mice. (A) Ranging of adipocytes according to their size as quantified by CellProfiler (3.1.5) from white adipose tissue sections from adult control (black squares) and HNF4αΔIEC (blue squares) mice (n = 7–8). The AUC calculated from control (black columns) and HNF4αΔIEC (white columns) mice (n = 7–8) is represented in (B). Dual-energy X-ray absorptiometry (DXA) measurements for body composition were acquired post-mortem from 4-month-old and 7-month-old mice. (C) Fat tissues (light yellow) and lean tissues (dark orange) are shown relative to total body weight of control (dark bordered squares) and HNF4αΔIEC (hatched squares) mice (n = 8–13). Osteodensitometry measurements for bone area (D), bone mineral content (BMC) (E) and bone mineral density (BMD) (F) of control (black columns) and HNF4αΔIEC (white columns) mice were calculated from DXA analysis (n = 8–13).

