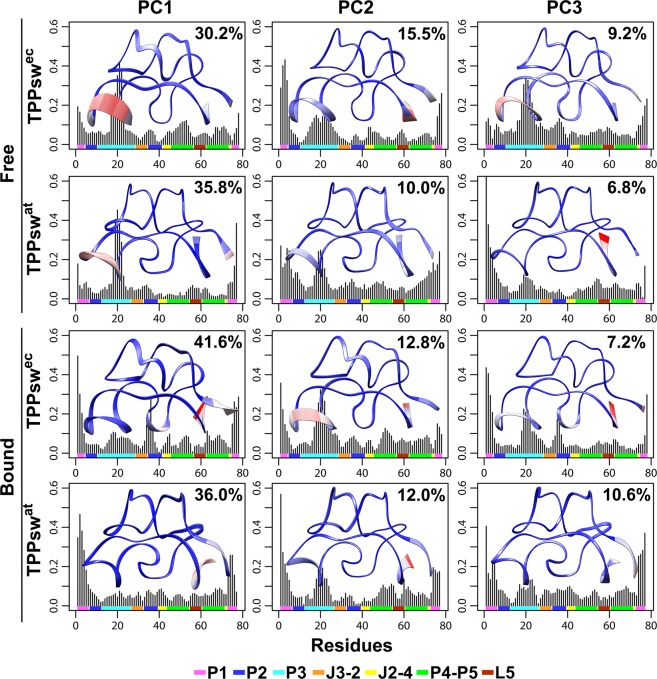
Figure 5.
RMSF contributed by the first three principal components. The fractional contribution of each PC to the overall variance is shown in the top right part of each graph. Interpolated structures obtained by displacements along each vector are displayed within each plot. Blue indicates overlapping regions with little or no motion. Red areas represent mobile regions. The secondary structure elements are given at the lower margin of the plots and colored according to the figure caption.

