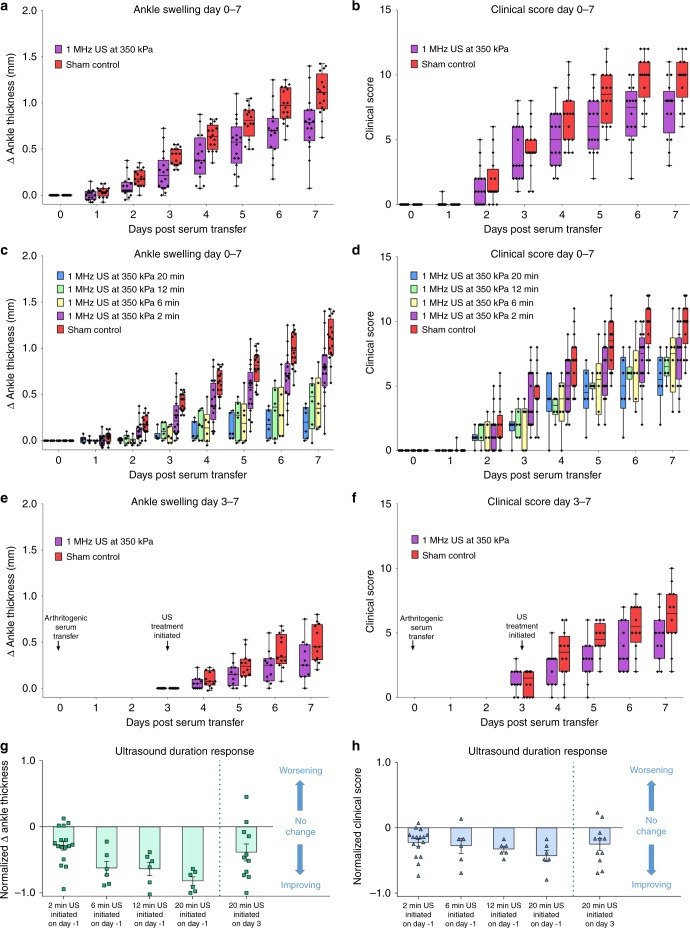
Fig. 3.
US treatment is effective before or after arthritis onset and depends on duration of stimulation period (page 18). All experiments in this figure used the 1 MHz US at 350 kPa, 1 s on/5 s off bursts in animals with arthritic serum transfer at day 0. a, b Full 7-day time course pooling data from the three experiments shown previously (Fig. 2a, b), which used identical experimental conditions for 2 min per day with US administered daily from day -1 through 6 (total n = 32). c, d Ultrasound duration causes a dose-dependent effect on arthritis. 6, 12, and 20 minute US stimulation was tested and is shown with the 2 min US and sham results from a, b for comparison. Figures show the 7-day progression of the disease and mice were stimulated with US from day -1 through day 6. For the 6, 12, and 20 min experiments, there were 6 animals per cohort (total n = 18) and for the 2 minute US and control data there were 16 animals per cohort (total n = 32). e, f US treatment is also effective at reducing symptoms after onset of arthritis. Treatment was not initiated until day 3 after arthritis had manifested. US was administered for 20 min per day. Data was pooled from two experiments with a total n = 23. g, h Normalized 7th day values of ankle thickness (g) and clinical score (h) for the different durations of ultrasound treatment shown in 3a–f. Error bars are SEM. 6, 12, and 20 minute values were normalized to the pooled sham control data from a, b. The bar “20 min US initiated on day 3” shows the improvement in ankle thickness and clinical score compared to the first day of treatment on day 3. In a–f, whisker plots are presented for better visualization of the data over time in which the endpoints of the vertical lines span the minimum to maximum values, the midline of each box is the median value and each box extends from the 25th to 75th percentile. In g, h, mean and SEM are plotted for each condition. kPa kilopascal

