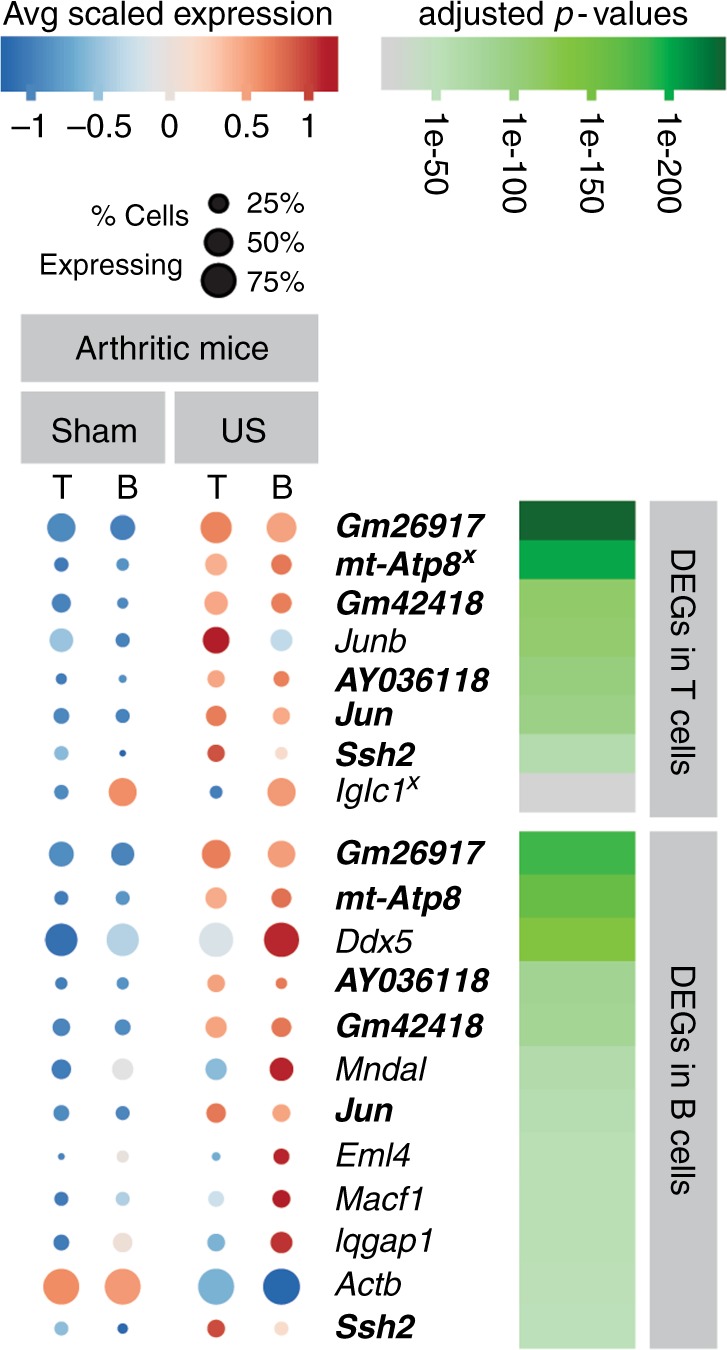
Fig. 4.

Splenic T and B cells demonstrate induction of genes following US treatment. The dot plot displays the statistically significantly differentially expressed genes (DEGs) in T cells (top list) and B cells (bottom list) from mice given arthritogenic serum comparing US versus sham-US stimulation. The size of each circle represents the percent of cells within each cell type (T cells = T, B cells = B) which express the gene listed, and the color of each circle represents average scaled expression. Gray bars denote mouse treatment groups; genes that are in bold are statistically significantly DEG in both T cells and B cells, and genes found to also be DEG in non-arthritic mice with US stimulation (see Supplementary Fig. 8) are denoted with a superscript x. Adjusted p-values for each gene in either T or B cells (top or bottom gene lists) are shown in shades of green. All DEGs listed in this Figure range in statistical significance from p = 2.39e-02 to p = 3.95e-230 using a Wilcox rank sum test with Bonferroni correction
