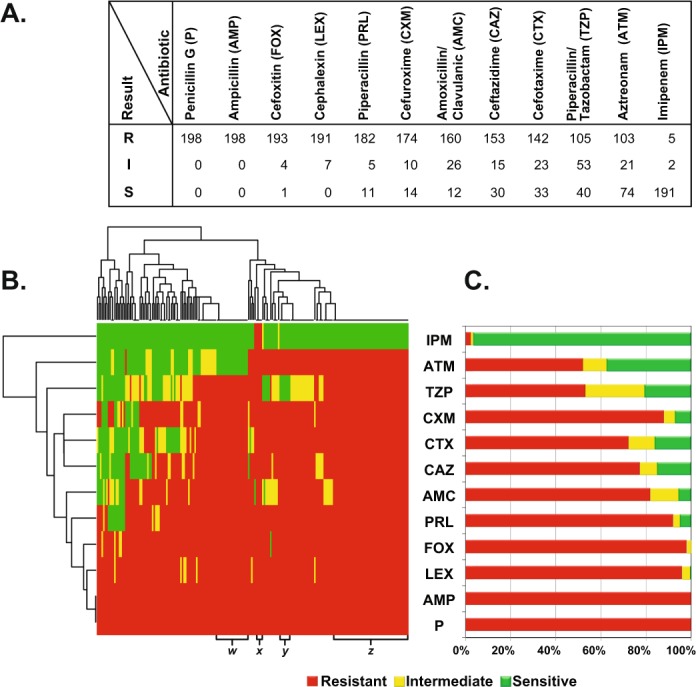
Figure 2.

Resistance phenotypes of all 198 E. coli isolates to 12 beta-lactams. (A) Tabular representation of the results of sensitivity tests, interpreted and classified into resistant (R), intermediate (I) and sensitive (S) according to CLSI24. (B) A transposed heatmap representing the resistance phenotypes of each isolate according to the color code shown in the figure key (red = resistant; yellow = intermediate; and green = sensitive). Isolates are shown on the X-axis and antibiotics on the Y-axis. Both isolates and antibiotics are ordered by hierarchical clustering, reflected by the horizontal and vertical trees, respectively. Antibiotic abbreviations are used as tabulated in A. Four clusters of interest (w, x, y, and z) representing different resistance patterns are annotated at the bottom of the heatmap. The heatmap was created in R by the basic heatmap function. C. A stacked bar plot summarizing the disc diffusion resistance patterns of the 198 E. coli isolates to 12 antibiotics (Y axis). Antibiotics are sorted by the same order in which they are clustered in B.
