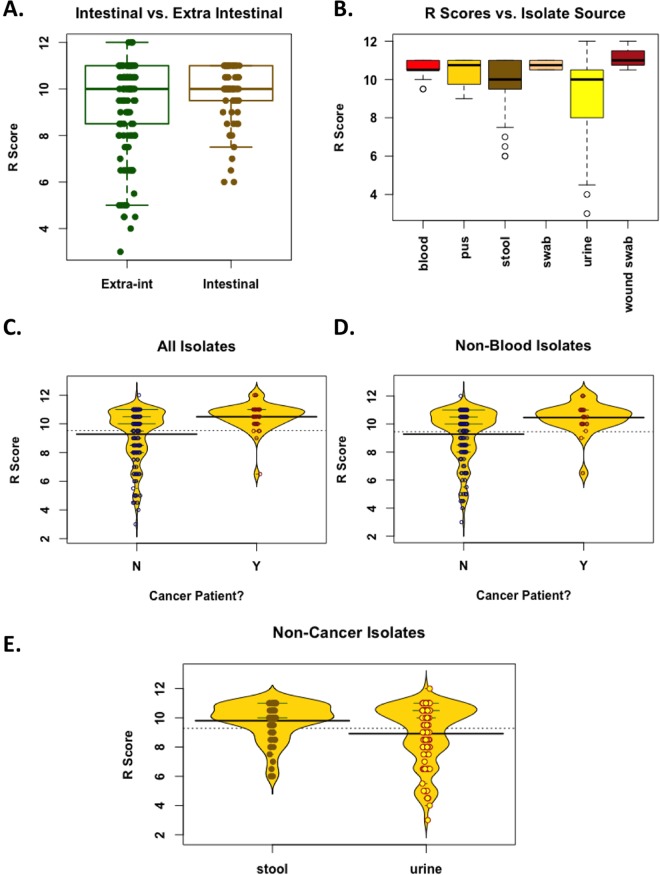
Figure 4.
Phenotypic associations. (A) Boxplots showing the R scores of intestinal vs. extra-intestinal samples. Dots representing each sample were overlaid to show the actual variability and distribution of the data. Medians = 10,10; means = 9.35, 9.84, for extra-intestinal and intestinal isolates, respectively. The difference, however, was marginally significant, especially that the data distribution does not follow a normal distribution (t-test p value = 0.033; but Mann-Whitney p value = 0.44). (B) Boxplots showing R scores of isolates from different body sites (for any site from which more than three isolates were available). The means were generally significantly different (ANOVA F value = 4.908, p value = 0.003). (C,D) Beanplots comparing patients with cancer (Y) vs. non-cancer patients (N) according to the R scores of their isolates. Dots representing each sample were overlaid to show the actual variability and distribution of the data. (C) When all isolates are considered, the difference in mean R score = 1.22; t-test p value = 2.284 × 10⁻⁸; Mann-Whitney p value = 2.266 × 10⁻⁵. (D) When all but blood isolates are considered, the difference in mean R score = 1.18, t-test p value = 2.96 × 10⁻⁵; Mann-Whitney p value = 0.0009. (E) A beanplot with overlaid dots comparing the R scores of stool vs. urine isolates from non-cancer patients. Mann-Whitney W = 3632.5, p value = 0.00887. All plots were created by R basic functions or the beanplot package.

