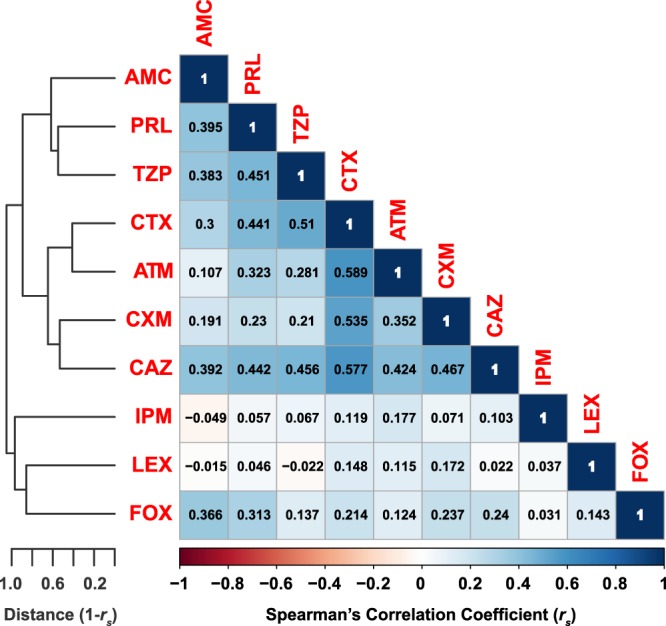
Figure 5.

Antibiotic-antibiotic correlations. A pseudo-colored asymmetric correlation matrix representing the correlations between each pair of antibiotics according to the patterns of susceptibility of all 198 isolates. Penicillin and ampicillin were not included as all isolates were resistant to them. Spearman’s rank correlation coefficients (rs) are shown for each antibiotoic pairs. The antibiotics are hierarchically clustered, and the clustering is represented by the tree shown to the left. Tree branches represent 1-rs. The CorrPlot R package and the basic hclust R function were used to create this figure.
