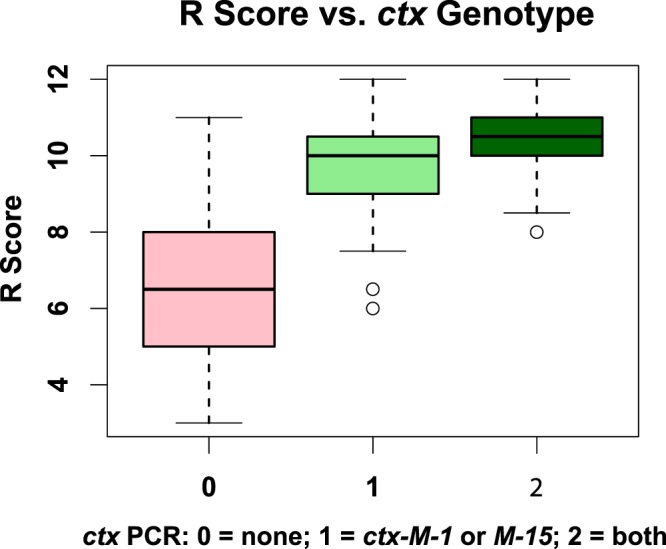
Figure 6.

Genotype-phenotype associations. Boxplots showing the relation between R score of an isolate and the detection of blaCTX-M-1 or blaCTX-M-15 or both by PCR. The three groups were statistically significantly different (ANOVA p value = 2 × 10⁻¹⁶). Post hoc one-tailed t tests with Bonferroni adjustment indicated that mean R scores are still significantly higher with the detection of both genes than with the detection of one gene (adjusted p value = 0.00052). Expectedly, the difference was more statistically significant with the absence of both genes (adjusted p value = 2 × 10⁻¹⁶).
