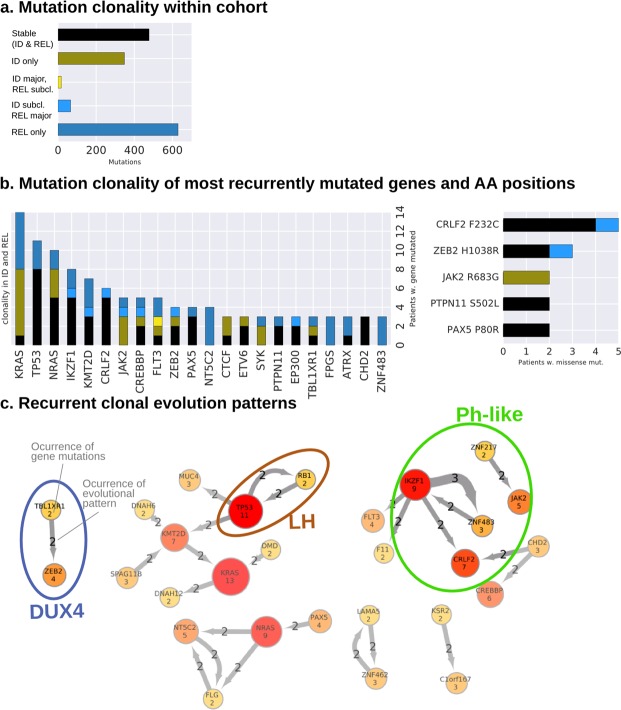
Figure 1.
The clonal evolution of BCP-ALL patients reveal volatile and stable gene mutations. (a) The left and middle plot shows the mutation counts (y-axis) categorized into different mutational evolution (x-axis). The bar in black shows the stable mutations that were detected in both ID and REL over 10% variant allele frequency (VAF). The green bar shows mutations, which were only detected in ID and disappeared in REL, followed by the yellow bar, which shows mutations that dropped from over 10% VAF in ID to under 10% VAF in REL. The light blue bar shows the amount of mutations, which were increasing VAF from subclonal levels (under 10%), whereas the last bar reflects the mutations what were only detected in REL over 10% VAF. (b) The mutation count (y-axis) of the most recurrent genes (x-axis) and their categorization of the clonal evolution, maintaining the color scheme from (a). The right-hand plot the same information for recurrent amino acid substitutions by missense mutations with inverted axes. (c) The network shows mutations occurring together in the same and/or in a subsequent clone: the observed mutations (amount in gene nodes) are connected by the arrows. The number in the arrow shows how many times the mutations occurred in the same or a descending clone. Relations between mutations associated exclusively with molecular subgroups are highlighted by the ellipses and labels of the defined subgroups.

