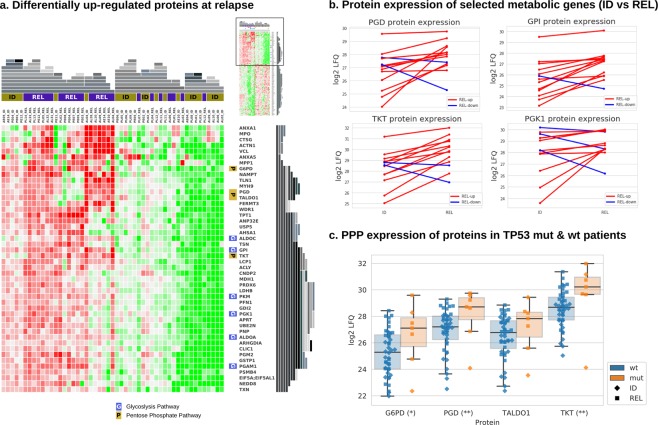
Figure 4.
Proteomics of BCP-ALL relapse. (a) The heatmap shows the proteins that are significantly up-regulated at REL. Proteins of the Phosphate Pentose pathway (PPP) and Glycolysis pathway, both overrepresented pathways at REL, are indicated at the right side of the heatmap by a P or G, respectively. The heatmap has been hierarchically clustered (top and right side representations in grey) using Gitools58. (b) Shows expression change of four metabolic proteins at ID and REL. If the net increase in expression is positive, the line is shown in red, otherwise in blue. (c) The box plots show protein expression levels of the members of the PPP as presented in the heatmap in (a), itemized by TP53 wild type (wt; n = 44) and TP53 sequence mutations (mut; n = 7). The significances are represented by the stars next to the protein name as follows: 1 star (*): 0.05 ≥ p > 0.01, 2 stars (**): 0.01 ≥ p > 0.001.

