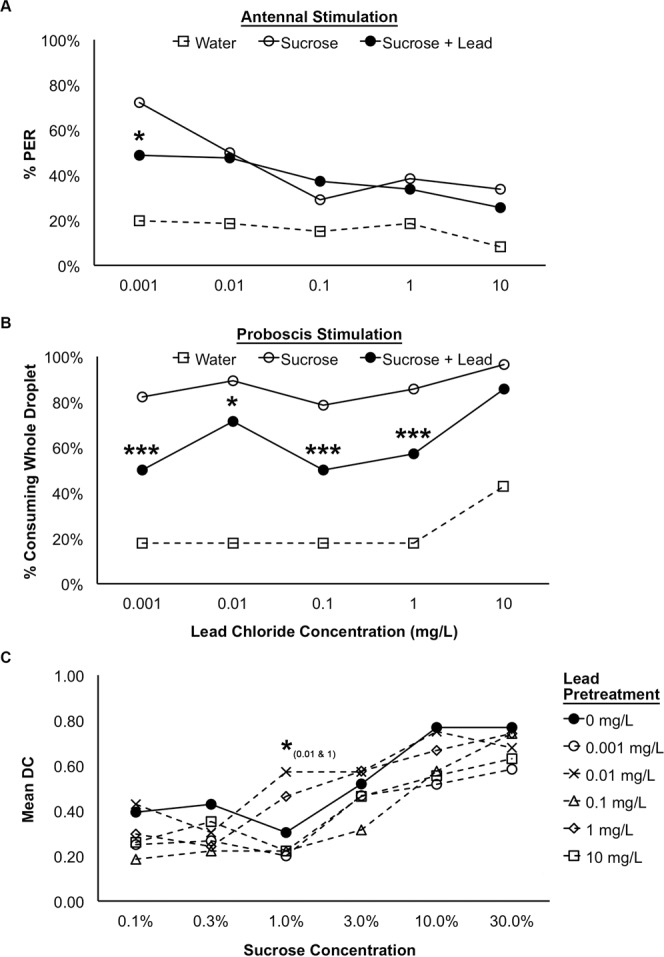
Figure 3.

The responsiveness of worker honey bees to antennal (A; n = 86) and proboscis (B; n = 28/treatment group) stimulation with water, sucrose, and sucrose contaminated with lead chloride and the effect of pretreatment with lead chloride on the sucrose response threshold in treated and control bees (C; 0 mg/L: n = 28, 0.001 mg/L: n = 30, 0.01 mg/L: n = 28, 0.1 mg/L: n = 27, 1 mg/L: n = 27, 10 mg/L: n = 27). For the assay testing responsiveness to antennal stimulation with lead-contaminated sucrose solutions, and the assay testing the sucrose response threshold following lead pretreatment, the percentages bees exhibiting the proboscis extension reflex (% PER) are shown. For the assay testing the bees’ responsiveness to proboscis stimulation with lead-contaminated sucrose solutions, the percentages of bees that consumed the whole droplet of each test solution (% consuming whole droplet) are shown. For the assay testing sucrose response thresholds in pretreated and control bees, mean DC indicates the mean value of the discrimination code. Bonferroni-corrected pairwise comparisons are indicated: ***p < 0.001, **p < 0.01, *p < 0.05 for antennal and proboscis response assays. Significance levels for model contrasts are indicated (***p < 0.001, **p < 0.01, *p < 0.05) for sucrose response threshold analysis.
