Fig. 1.
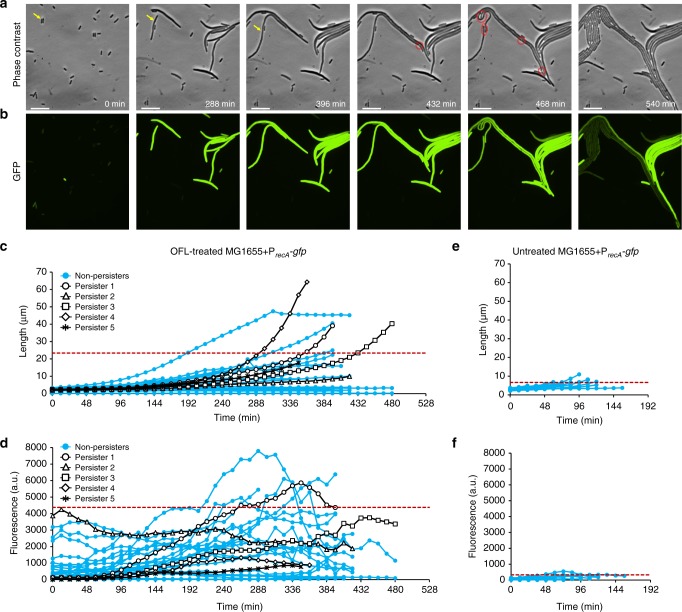
Time-lapse microscopy with E. coli MG1655. a Representative phase contrast and b GFP fluorescence images of recovering OFL-treated wild-type MG1655 E. coli bearing PrecA-gfp. Yellow arrow indicates persister. Red circles indicate division events. The far-right panel shows the incipient colony formation from a persister. Images are representative of six biological replicates. c Growth and d fluorescence of OFL-treated (n = 30) and e, f untreated cells (n = 20) recovering from treatment were analyzed. Of the 30 treated cells, five were persisters (black data points) and 25 were non-persisters (blue markers). 95% of the cell length and fluorescence measurements lie below the respective red dashed lines in c–f. The scale bars represent 10 μm. Refer to Supplementary Movies 1–3 for time-lapse videos

