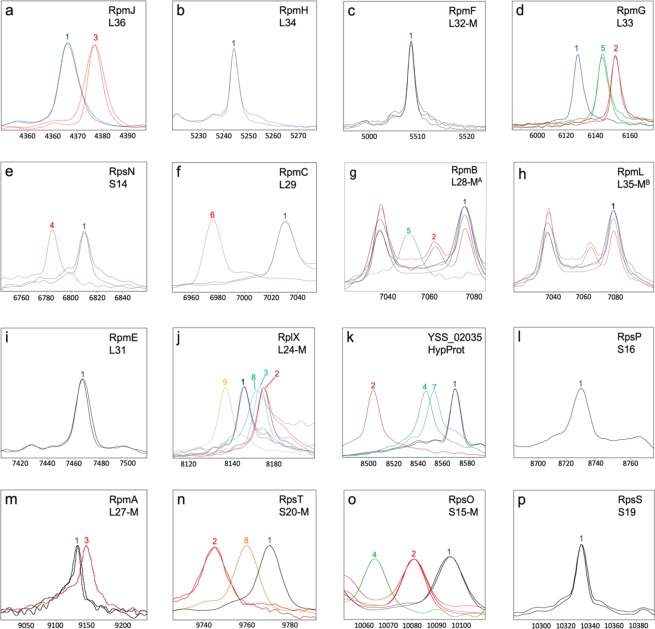
Figure 3.
C. coli-specific proteotyping biomarkers (a–o). Spectra of representative C. coli strains were superimposed to illustrate the mass differences between allelic isoforms detected in our C. coli collection. X-Axis: mass [Da] charge-1 ratio, scale 200 Da. Y-Axis: intensity [10x arbitrary units], spectra were individually adjusted to similar noise level for better visualization of low-intensity peaks. Color codes: the isoform of C. coli reference strain RM4661 is illustrated in blue; red, light green, dark green, purple and orange are further isoforms. Isoforms lacking N-terminal methionine are appended with “-M”. A(g) The peak at m/z ≈7,079 is a superposition of the biomarker ion masses L28-M (m/z = 7,078) and L35-M (m/z = 7,080). In contrast, the allelic isoforms 2 and 3 (−14 Da and −28 Da, respectively) are mere L28-M peaks. B(h) For the biomarker L35-M we could only detect one allelic isoform in our test cohort, which is superimposed by the biomarker mass L28-M in the spectrum of C. coli RM2228. In order to show the not superimposed L35-M peak in h an additional spectrum of a clade 3 C. coli isolate was added, in which the L28-M peak is shifted by −14 Da and therefore L35-M is not superimposed.

