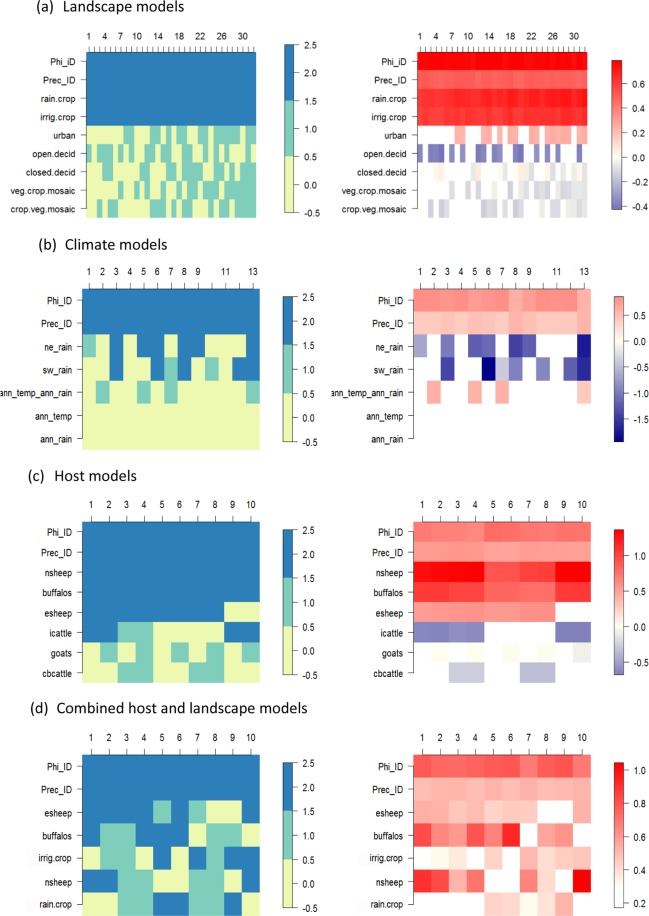
Figure 2.
Presence and significance and coefficient values for random and fixed effects present in the top set models of each category. The left hand plots indicate whether predictors are absent (yellow), present but non-significant (green), or present and significant (blue) in each top model. The right hand plots indicates the coefficient values for predictors when present in each top model. In each panel, models are numbered along the x-axis, ranked in order of model performance, from low DIC (“best”, left-hand side) to high DIC (“worst”, right-hand side). The Intercept term was present with significant negative impacts in all models and is not shown. The fixed effect predictors are ordered by the number of times they appeared in the top model set from most (top) to least (bottom) and their names are abbreviated as in Table 1. The spatial random effects are precision (Prec_ID) and the phi parameter, (Phi_ID).

