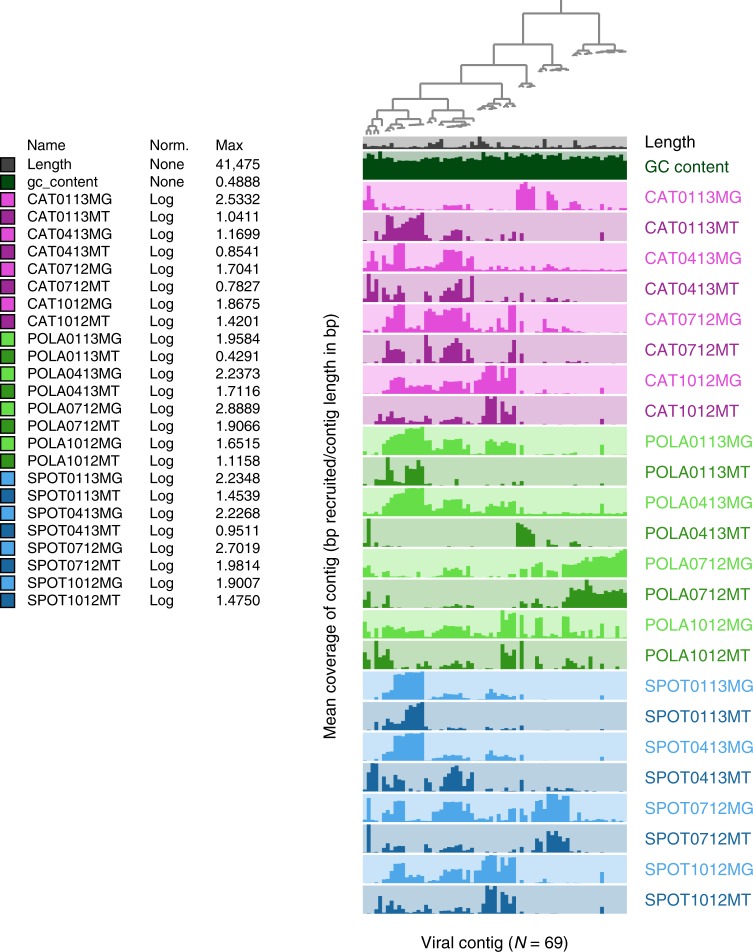
Fig. 1.
Dynamics of active infections over seasons and sites. Mean coverage, as a proxy of relative abundance, of 69 viral contigs across three sites (Port of LA—POLA, San Pedro Ocean Time-series—SPOT and Two Harbors—CAT) and four seasons (July 2012, October 2012, January 2013, and April 2013) in metagenomes (MG) and metatranscriptomes (MT). Each column represents one contig and each row represents one sample. The bar heights are relative to the highest log-transformed mean coverage within each sample, detailed in the legend column Max. Mean coverage, based on bowtie2 mapping, was calculated excluding contig positions whose coverage depth was in the top 25% of coverage, as they may be biased by non-specific recruitment localized to short, highly conserved portions of the contig (Supplementary Figure 3). The dendrogram denotes hierarchical clustering of the contigs by abundance79

