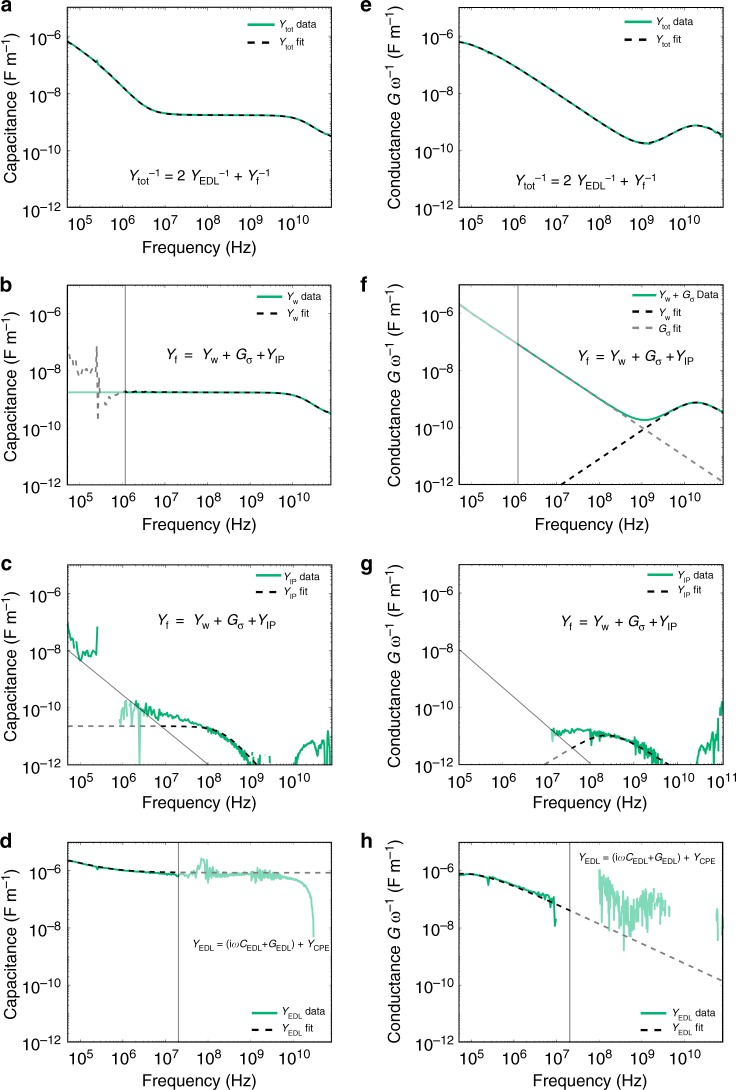
Fig. 5.
Example fitting procedure of Ytot = Gtot+iωCtot for closed DNA tweezer data. Distributed capacitance (a–d) and conductance (e–h) data are green lines in all plots. All dotted lines are fitted equations. Data for the individual circuit components are shown by subtracting all other fitted components from the total distributed capacitance and conductance. a, e Data and fit of Ctot and Gtot. b, f Data and fit of Cw, Gw (black dotted lines), and Gσ (gray dotted line). c, g Data and fit of CIP and GIP. d, h Data and fit of CEDL and GEDL. Lighter shaded regions indicate where the extracted parameters are not well conditioned due to a high signal-to-noise ratio

