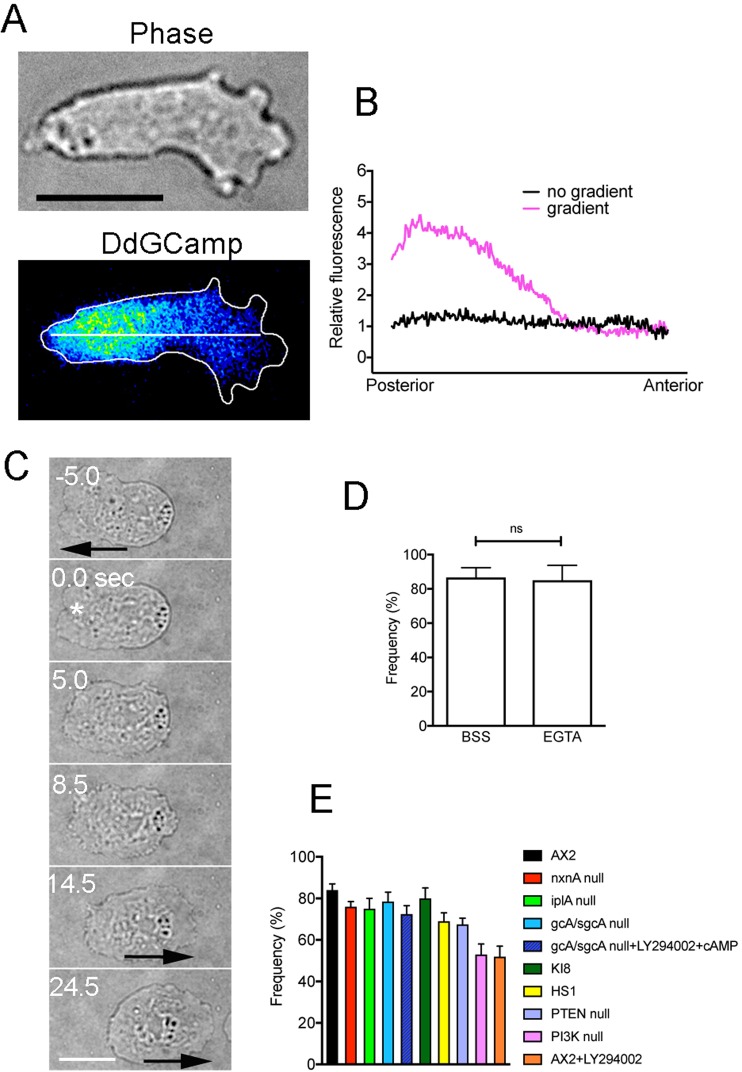
Figure 3.
Signals for the escape behavior of cells. Supplementary Tables cells expressing Dd-GCaMP6s were observed by TIRF microscopy. (A) typical cell showed a shallow decreasing Cai2+ gradient from the posterior to the anterior regions. However, the gradient was observed in only 20% of examined cells (n = 100). (B) Quantitative analysis of fluorescence intensities along the long axis of migrating cells as shown as the white line in Panel A. Two curves were derived from averaged curves of 17 cells with and without the gradient. (C) Typical cell behavior after wounding at the anterior region (asterisk) in the presence of 5 mM EGTA. Arrows indicate the direction of cell migration. (D) Frequency of the reversal after cells were wounded at the anterior regions in the presence of BSS and EGTA. Data are presented as mean ± SD (n = 30, each). (E) Frequencies of the opposite migration of mutant or wild-type cells in the presence of inhibitors after local wound. Data are presented as mean ± SD (n = 70, each). Detailed description of mutants and inhibitors are described in Supplementary Table S1. Bars, 10 µm.

