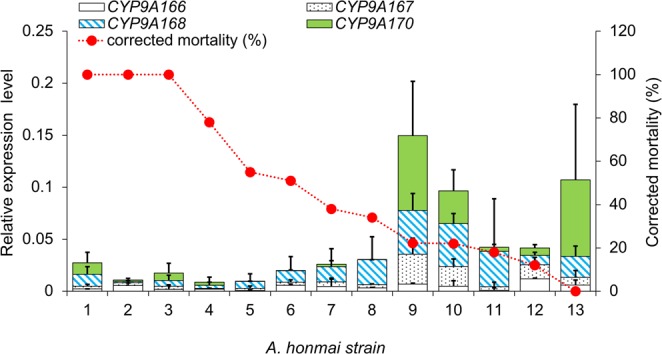
Figure 7.

Relationship between the expression levels of four CYP9A genes and corrected mortality in 13 Adoxophyes honmai strains. Bars indicates the expression levels of four CYP9A genes relative to a reference gene (rp49) as obtained by quantitative real-time PCR (mean + standard deviation, n = 3). The relative expression levels of CYP9A166 (open bars), CYP9A167 (dotted bars), CYP9A170 (filled bars), and CYP9A168 (diagonal-striped bars) are indicated for each strain, along with corrected mortality (red dots). The numbers at the bottom indicate the strains of A. honmia listed in Supplementary Table S8.
