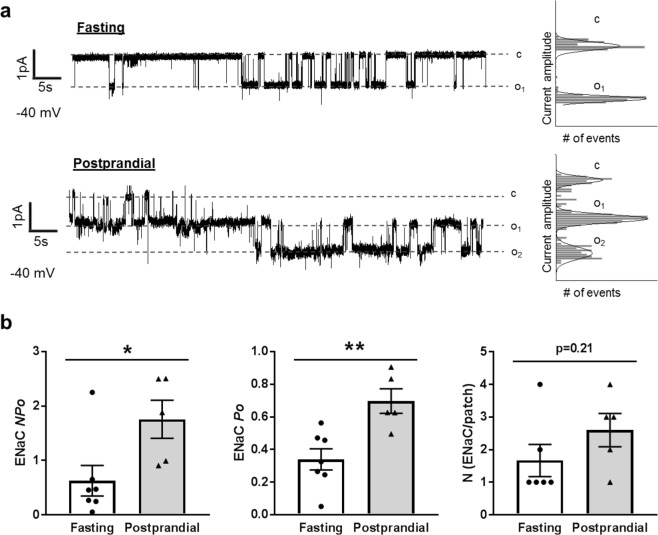
Figure 3.
ENaC activity in isolated cortical collecting duct (CCD) tubules. (a) Representative current traces from cell-attached patches containing ENaC recorded from the apical membrane of split-open CCD cells of fasted or postprandial Sprague-Dawley rats. Event probability histograms of the representative traces showing the distribution of open and closed states are depicted to the right of the trace. (b) Summary graphs of ENaC activity (NPo), channel open probability (Po) and the average number of channels per patch from isolated CCDs. *p < 0.05, **p < 0.01, respectively, N ≥ 5 rats.

